Red Bull's creator marketing89 owned accounts, creators who film the can, and where close-up reviews lag
Red Bull runs one of the largest owned media networks on TikTok: 89 verified brand accounts posting 8,859 times in six months (337 posts a week). Yet when we analysed 5,370 public TikToks from 1,996 UK and US creators tagging Red Bull — plus 1,459 Instagram posts — we found two surprises for brand marketers. First, despite Red Bull's extreme-sport reputation, the drink itself is the #1 thing creators film (29.8% of videos). Second, across the 860 baseline-eligible posts in our 1,511-post visual review, the pooled product close-up, review, and taste-test format had the lowest observed sample standout rate (6.2% across 97 eligible posts), trailing dance (29.3%), hauls and shopping (22.2%), comedy sketches (19.5%), and event signage or kit branding (18.5% to 19.3%).
Public TikTok and Instagram posts uploaded 1 May to 31 October 2026 by UK and US creators. Method and limits at the foot of the page.
TikTok and Instagram posts uploaded 1 May to 31 October 2026, UK and US creators, read 18 to 20 November 2026
Two definitions up front. By UGC, we mean public TikToks that matched none of our TikTok ad-label, Shop, or screened partner/gift caption rules (undisclosed deals, athlete arrangements, and unlabelled gifts sit inside this bucket, while co-tagged commercial posts sit outside it). And because raw views mostly reflect creator size, we benchmark each indexed TikTok against that creator's own six-month median views (covering 3,118 of 5,370 creator posts from creators with at least 10 indexed posts) and call anything hitting 3 times their usual or more a standout (15.3% overall, 14.1% when every creator gets equal weight). That measures attention against a creator's normal reach — not can sales or brand lift.
1. The 89-account media network vs what creators actually film
Red Bull splits its owned TikTok publishing across a global flagship, regional country feeds, and 28 dedicated sport, music, dance, and event channels (89 verified brand accounts in total, 73 active during the six months, 128.3 million combined followers). We counted 11 verified sports team accounts (including Formula 1) separately: they posted 855 times and drew 697 UK and US creator posts from 156 creators.
Red Bull's verified TikTok accounts
One dot is one account. Team accounts (hollow) are counted separately from the 89 brand accounts.
1@redbull (global)
290 posts · 11.0 a week
3UK and US accounts
471 posts · 17.9 a week
28Sport, culture and event channels
2,618 posts · 99.6 a week
57Other country accounts
5,480 posts · 208.5 a week
11Team accounts
855 posts · 32.5 a week
Account group
Accounts
Followers (millions)
Posts in six months
Posts a week
@redbull (global)
1
24.0
290
11.0
UK and US accounts
3
10.1
471
17.9
Sport, culture and event channels
28
34.8
2,618
99.6
Other country accounts
57
59.4
5,480
208.5
Team accounts (counted separately)
11
11.9
855
32.5
Even with 337 owned posts a week globally, creators still out-publish Red Bull's local accounts by more than eleven to one:
UK and US creators tagging Red Bull:5,370 posts (1,996 creators; UK creators made 18.8%).
Red Bull's three UK and US accounts:471 posts (17.9 a week) -> 11.4 creator posts per UK/US brand post.
Global @redbull account:290 posts (11.0 a week) -> 7.1 creator posts per post across global plus UK/US.
Creators overwhelmingly tag the main hubs: 3,716 posts (1,464 creators) tagged global @redbull, 1,948 (610 creators) tagged the UK/US accounts, and 806 (236 creators) tagged the 28 niche sport and culture channels.
Yet when we sorted 1,511 randomly sampled creator videos from six silent frames each, the creator feed looked nothing like a Red Bull extreme-sports channel: 29.8% were about the drink itself (new flavour taste tests, hauls, recipes). Motocross and motorbikes were second (11.7%), while bike, skate, surf, and snow — the flagship extreme sports — were just 3.3%.
2. The concentration check: 69 creators make 40.9% of posts, and one account makes half of all ad labels
Before drawing conclusions from any headline share on an athlete-heavy brand, check who actually posted. On Red Bull, concentration is extreme in both overall volume and commercial labels.
Extreme concentration: a small core drives both volume and ad labels
5,370 UK and US creator posts from 1,996 accounts, 1 May to 31 October 2026.
Share of creatorsShare of posts
Posted once
67.5%
25.1%
2 to 4 posts
24.4%
22.7%
5 to 9 posts
4.6%
11.3%
10 or more posts
3.5%
40.9%
40.9%
Of posts from 69 creators
3.5% of creators · #1 poster made 378 posts (7.0%)
51.4%
Of all ad labels from ONE account
170 of 331 labelled posts · share drops 6.2% → 3.1% without it
0.8%
Ad/Shop share on 1M+ creators
168 mega-creators · public data cannot see athlete contracts
A small core drives two-fifths of all volume.67.5% of creators (1,347) tagged Red Bull once in six months. At the other end, 69 creators (3.5%) posted 10 or more times and generated 40.9% of all 5,370 posts (8 posted 50 or more times, and one creator posted 378 times — 7.0% of the entire dataset). Because frequent posters are easier to capture in public indexing than one-off posters, preferential capture may tilt this observed 40.9% share upward.
One account accounts for half of all ad labels. Across all 5,370 posts (including Shop), 331 posts (6.2%, 91 creators) carried TikTok's commercial-content label. One single account posted 170 of those 331 (51.4%). Without that account, Red Bull's ad-label share drops in half to 3.1%. Of the 91 creators with a labelled post, 69 had exactly one.
Paid-signal bench skews small; mega-creator labelling is near zero. Excluding Shop, 281 posts (5.2%) carried the ad label plus 3 with a screened partner tag (284 non-Shop paid-signal posts across 68 creators; 76.5% posted once, 64.7% under 100,000 followers, and one account made 161 of those 284, or 56.7%). Among 168 mega-creators (1,000,000 or more followers), just 0.8% of posts carried an ad label or Shop link. Red Bull is publicly known for long-term athlete and event relationships; public posts cannot show contracts or terms, and nothing here implies any unlabelled post required disclosure.
3. Where close-ups and taste tests lag behind culture, hauls, and event branding
Across 3,118 baseline-eligible indexed posts, 15.3% stood out at 3 times the creator's usual views or more (14.1% creator-weighted, median 1.0 times usual). Splitting the 860 baseline-eligible posts in our 1,511-post random visual review by format, topic, and visible branding shows observed sample rates that invert the product-first pattern seen in apparel (note: these are descriptive sample rates without creator-clustered confidence intervals):
On Red Bull, close-ups & taste tests sit lowest in our 860-post eligible sample
Share of baseline-eligible indexed posts hitting 3× the creator's usual views (3,118 of 5,370 posts: 15.3% overall).
Above Red Bull baseline (15.3%)Below baseline
How the video is filmed (860 eligible posts in 1,511-post review)
Haul or shopping find
22.2%
Comedy sketch or meme
19.5%
Tutorial or recipe
16.7%
Event footage
14.8%
Sport or performance footage
14.6%
Close-up, review or taste test
6.2%
Topic of the video (same sample)
Dance
29.3%
Comedy / entertainment
23.2%
The drink (taste tests, flavours)
13.6%
Bike, skate, surf and snow
7.5%
What branding appears on screen (same sample)
Event signage
19.3%
Kit, helmet or vehicle
18.5%
Can or drink
17.2%
Incidental or absent role
16.2%
Main subject role
15.7%
Product close-ups, reviews, and taste tests sit lowest in our sample. Despite the drink being the #1 topic creators film (29.8% of posts), the pooled product close-up, review, and taste-test format stood out 6.2% of the time (5.1% creator-weighted, across 97 baseline-eligible posts — well below Red Bull's 15.3% overall rate). In the same sample, hauls and shopping sat at 22.2% (20.1% creator-weighted, 45 eligible posts), comedy sketches at 19.5% (19.8% creator-weighted), tutorials and recipes at 16.7%, event footage at 14.8%, and sport footage at 14.6%.
Red Bull does not need to be the subject to break out. Unlike apparel (where product-as-subject doubles standouts), Red Bull's standout rate is virtually flat whether the brand is the main subject (15.7%, 15.7% creator-weighted) or incidental or absent (16.2%, 14.5% creator-weighted).
Stage, kit, and culture beat the can. By topic, dance led at 29.3% standouts (27.8% creator-weighted, 58 baseline-eligible posts), followed by comedy (23.2%, 23.6% creator-weighted) — while the drink sat below average at 13.6%. By what is visible on screen, event signage (19.3%, 19.4% creator-weighted) and branding on kit, helmet, or vehicle (18.5%, 21.0% creator-weighted) both beat the can (17.2%). In the 149 reviewed top-150 most-viewed posts (87 creators; note one motocross rider made 34 of them), branding on a helmet, kit, or vehicle (31.5%) overtakes the can (26.8%), and drink videos fall from 29.8% of all posts to 16.8%.
Two creative lanes worth testing
Lane 1: Build a physical stage, course, or finish arch people film automatically
UGC
POV ride across a floating lake course ending at a Red Bull arch
Three UGC standouts built around physical Red Bull stages, courses, and finish arches. Stills from public TikTok videos.
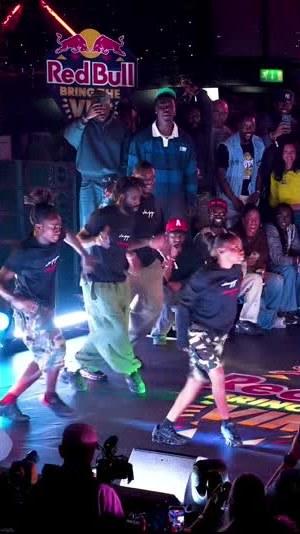
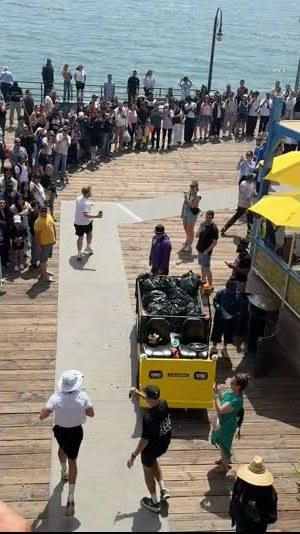
Red Bull's biggest UGC breakouts put branding onto an unmissable physical backdrop: a POV ride across a floating lake plank course ending at a Red Bull arch (18,257,342 indexed views, 437 times usual), a dance crew battle on a Red Bull Bring The Vim stage (11,173,459 indexed views, 341 times usual), and a crowd sprinting down a seaside pier toward a Red Bull finish arch (4,694,691 indexed views, 620 times usual). Creators aren't asked to review a beverage; the physical structure is the video.
Brief to test: You don't need a Red Bull-scale event to test this: put branding onto any physical focal point — a pop-up backdrop, challenge prop, or local race finish banner — and brief creators to film the moment rather than a product shout-out.
Lane 2: Turn seasonal SKUs into retail treasure hunts, puzzles, or comedy props
UGC
Shopper spotting Red Bull Advent Calendars stacked on Target shelves
Three UGC standouts where the can is a retail treasure hunt, lockbox puzzle, or comedy prop. Stills from public TikTok videos.
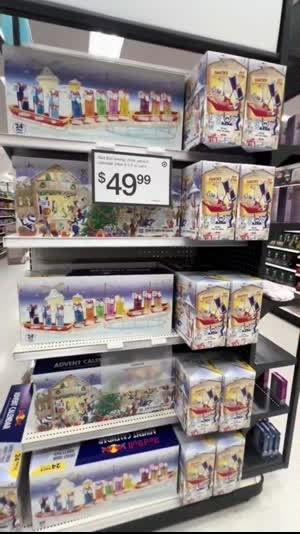
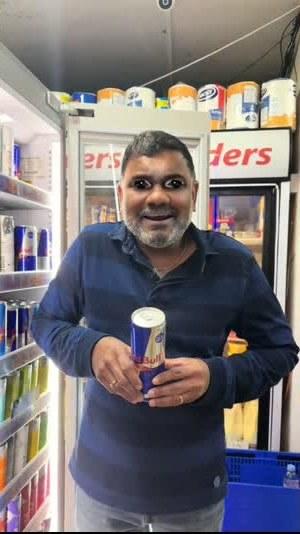
When the can does break out, it rarely looks like a sit-down taste test. Look at three selected UGC standouts: a shopper discovering Red Bull Advent Calendars stacked at Target (1,324,837 indexed views, 1,191 times usual), a creator trying to crack a Red Bull-branded wooden lockbox with a code (2,629,634 indexed views, 68 times usual), and a convenience-store POV skit switching between water and a Red Bull can (2,023,246 indexed views, 287 times usual). Creators also adopt Red Bull's own vernacular unprompted: 332 posts (141 creators) used "gives you wings", and 190 posts (69 creators) wrote "sponsor me" next to the tag.
Brief to test: Replace sit-down flavour taste tests with a retail scarcity hunt ("found at Target"), a physical puzzle/unlock box, or a 15-second workplace or store POV skit where the can is the punchline.
4. Beyond TikTok tags: Instagram Collabs, TikTok Shop, and co-tagging
Beyond Red Bull's TikTok tags: Instagram Collabs, TikTok Shop, and sports teams
Public TikTok and Instagram feed posts, 1 May to 31 October 2026. Instagram Stories are not visible in public feed data.
401k
Median plays on 35 IG Collabs
35/35 w/ plays · vs 33k on 617/1,422 non-Collab posts
50
TikTok Shop posts (0.9%)
Seller IDs on 18 of 50 (32 missing)
11
Sports team accounts (separate)
855 team posts · 697 creator tags from 156 creators
Instagram Collabs sit far above non-Collab tagged posts on median plays. Across 1,459 public Instagram posts tagging or co-authored with Red Bull's main accounts (730 creators, 38,130 overall median video plays across 654 posts with plays), only 6 (0.4%) carried a paid partnership label. Splitting Collabs from regular tags cleanly: 35 official Collab posts (35 of 35 with recorded plays, 24 creators) had 400,525 median plays, compared with 33,445 median plays across non-Collab tagged posts (617 of 1,422 with recorded plays). That is a descriptive split across two different post types, and Instagram Stories are not visible in public feed data.
TikTok Shop is under 1% of posts. Just 50 posts (0.9%) carried a Shop link or flag; seller IDs were recorded on 18 and missing on 32, and no official Red Bull seller is configured in our dataset.
Clean co-tagging once the top outlier is removed.70.0% of Red Bull posts tag three or fewer accounts. Removing the single 378-post outlier (who tags the same small group of brands in nearly every upload), the most frequent co-tags are sports, racing, and energy-adjacent accounts:
Account tagged in the same post
Share of posts tagging Red Bull, leaving out the most frequent poster
@motosportinc
3.9%
@allballsracing_
3.9%
@mcdonalds
3.1%
@wildmandrinking
2.9%
@subwayukireland
2.0%
@greggsofficial
1.9%
@toraniflavor
1.8%
@justeatuk
1.8%
5. Four tests for a culture- or event-led brand
Test event, challenge, and comedy briefs against product close-up and taste-test reviews. In our 860-post eligible visual sample, product close-ups, reviews, and taste tests stood out 6.2% of the time versus 29.3% for dance, 22.2% for hauls and shopping, and 19.5% for comedy sketches.
Test Instagram Collabs on major cultural moments. Thirty-five official Collab posts (35 with plays) had 400,525 median plays versus 33,445 across 617 non-Collab tagged posts with plays.
Test hauls and physical unlocks alongside sit-down flavour reviews. In the visual sample, hauls and shopping stood out 22.2% of the time versus 6.2% for product close-ups, reviews, and taste tests; selected examples like Target shelf finds and lockbox puzzles show concrete ways to test that lane.
Always strip out your #1 poster before reading creator shares. On Red Bull, one account made 51.4% of ad-labelled posts and 69 accounts made 40.9% of all posts; headline brand shares without concentration checks mislead leadership.
One metric to add to your campaign wrap: track creator-weighted standout rate alongside raw standout rate, plus top-creator share of posts and labels, so one prolific partner cannot disguise how the rest of the bench performed.
How we ran this analysis, and its limits
Public data scope and sources:89 verified Red Bull brand accounts (8,859 posts; 11 team accounts tracked separately), 5,370 public UK and US creator TikToks tagging any of those 89 accounts (1,996 creators), and 1,459 public Instagram feed posts tagging or co-authored with @redbull, @redbullusa, or @redbulluk (730 creators), uploaded 1 May to 31 October 2026. For TikTok creators, we started from Kyra's indexed public dataset and refreshed each identified creator's public posts over the six months. Untagged UGC, creators outside the initial pool, and Instagram Stories are not captured, so totals are floors.
How TikTok posts are grouped:Paid-signal (non-Shop) = TikTok ad label excluding Shop (281 posts) plus 3 caption-only partner matches (284 posts across 68 creators). Separately, 331 posts across 91 creators carried TikTok's platform commercial-content label when Shop posts are included. Gifted = caption mentions a gift or invite (34 posts). TikTok Shop = Shop link or flag (50 posts). UGC = everything else (5,002 posts, 93.1%; 17.6 UGC posts per paid-signal post). Undisclosed deals, athlete agreements, and gifts sit inside UGC, while co-tagged commercial posts sit outside it. Nothing here implies any unlabelled post required disclosure.
Standouts: Indexed post views divided by that creator's six-month median views in Kyra's indexed dataset (creators with at least 10 indexed posts: 3,118 of 5,370 posts), keeping numerator and denominator on the same ingestion basis. Views include any paid promotion behind a post. Both raw post-level and creator-weighted standout rates are reported throughout.
Visual review:1,511 randomly chosen creator TikToks (860 baseline-eligible for the creative standout splits; the 2.5-point margin applies to the full random sample's category shares, not standout comparisons) and 149 of the 150 most-viewed still live were sorted from six silent frames each (audio omitted) into fixed categories by an AI classifier. Human accuracy spot-checks were not run on the full visual sort; treat fine margins as directional. Featured standout stills were inspected individually.
What public data can't show: These are observational patterns in public attention (views), not controlled experiments, and they do not measure can sales, brand lift, athlete contract terms, or what anyone was paid.
Frequently asked questions
How many TikTok accounts does Red Bull run?
Red Bull operates 89 verified brand TikTok accounts (73 active over six months, 128.3 million combined followers) posting 8,859 times (337 posts a week), plus 11 separate verified sports team accounts (855 posts).
What do creators actually film when they tag Red Bull on TikTok?
Across 1,511 randomly reviewed UK and US creator TikToks, the drink itself was the #1 topic (29.8%), ahead of motocross and motorbikes (11.7%), while flagship extreme sports (bike, skate, surf, and snow) accounted for 3.3%.
How do product close-ups and taste tests perform on Red Bull?
Across the 860 baseline-eligible posts in our 1,511-post visual sample, the pooled product close-up, review, and taste-test format had the lowest observed standout rate (6.2% across 97 eligible posts; 5.1% creator-weighted), trailing dance (29.3%), hauls and shopping (22.2%), comedy sketches (19.5%), event signage (19.3%), and kit/helmet/vehicle branding (18.5%).
How do Red Bull's Instagram Collabs compare with regular tagged posts?
Between 1 May and 31 October 2026, 35 co-authored Instagram Collab posts with Red Bull (35 of 35 with plays recorded) had a median of 400,525 plays, compared with 33,445 median plays across the 617 non-Collab tagged posts with plays recorded.
Want this analysis for your brand and category rivals?
Kyra runs a six-month creator benchmark on your brand using public TikTok and Instagram data alongside your in-house team and existing creative partners — separating owned media from creator reality, auditing creator concentration, and delivering creative briefs to test.


 LinkedIn