How it stacks up against rivals, and what to test
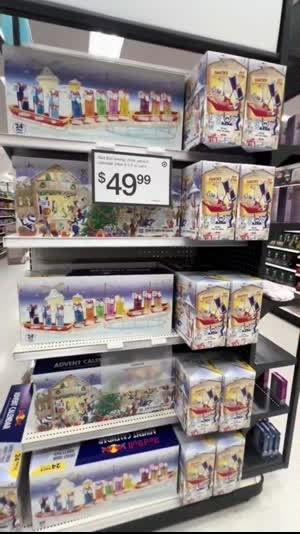
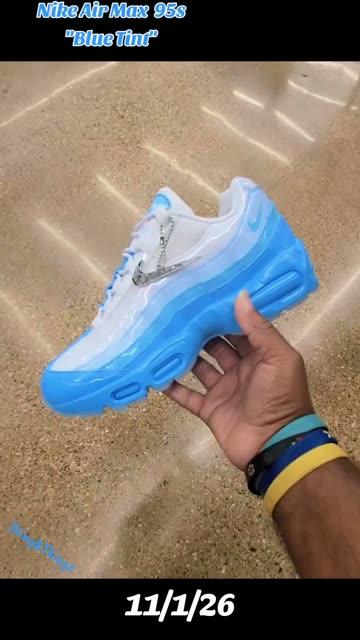
We analysed 12,891 TikToks and 5,765 Instagram posts tagging Nike over six months, and benchmarked Nike apples-to-apples against adidas, New Balance, and Puma in Kyra's indexed dataset over the same six months. The assumption most marketers bring to a Nike teardown ("well, it's Nike") only holds on total captured tag volume. In Kyra's indexed dataset, the observed standout rates among baseline-eligible posts were 18.8% for Puma, 15.7% for adidas, 14.1% for Nike, and 12.2% for New Balance — and more ad-labelled non-Shop posts and creators tagged adidas than tagged Nike. And even inside Nike's own calendar, UGC per paid-signal post swings from 1.3 to 19.3 across five product and event groups.
One flagship in a 17-brand portfolio, and why occasion beats product-only
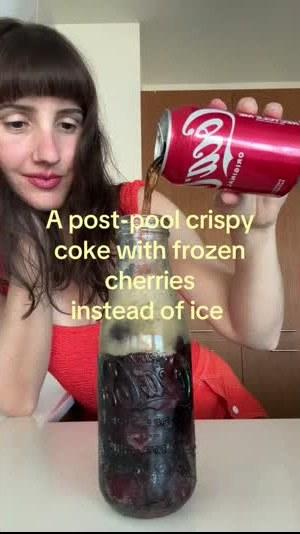
We analysed 7,155 public TikToks tagging 17 brands owned by The Coca-Cola Company — including 2,254 tagging flagship @cocacola and 545 Instagram posts — over six months. For multi-brand consumer marketers, the surprise is not Coca-Cola's scale. It is that Coca-Cola's flagship account (5.5 million followers) draws less than a third (31.5%) of the company's creator posts while fairlife (41,602 followers, 1,782 posts) and Diet Coke (254,738 followers, 1,356 posts) together outnumber the flagship with far higher repeat-creator rates — and inside @cocacola itself, videos where Coke is one part of a wider occasion stand out more often than videos made solely about the drink.
89 owned accounts, creators who film the can, and where close-up reviews lag
Red Bull runs one of the largest owned media networks on TikTok: 89 verified brand accounts posting 8,859 times in six months (337 posts a week). Yet when we analysed 5,370 public TikToks from 1,996 UK and US creators tagging Red Bull — plus 1,459 Instagram posts — we found two surprises for brand marketers. First, despite Red Bull's extreme-sport reputation, the drink itself is the #1 thing creators film (29.8% of videos). Second, across the 860 baseline-eligible posts in our 1,511-post visual review, the pooled product close-up, review, and taste-test format had the lowest observed sample standout rate (6.2% across 97 eligible posts), trailing dance (29.3%), hauls and shopping (22.2%), comedy sketches (19.5%), and event signage or kit branding (18.5% to 19.3%).