Nike's influencer marketingHow it stacks up against rivals, and what to test
We analysed 12,891 TikToks and 5,765 Instagram posts tagging Nike over six months, and benchmarked Nike apples-to-apples against adidas, New Balance, and Puma in Kyra's indexed dataset over the same six months. The assumption most marketers bring to a Nike teardown ("well, it's Nike") only holds on total captured tag volume. In Kyra's indexed dataset, the observed standout rates among baseline-eligible posts were 18.8% for Puma, 15.7% for adidas, 14.1% for Nike, and 12.2% for New Balance — and more ad-labelled non-Shop posts and creators tagged adidas than tagged Nike. And even inside Nike's own calendar, UGC per paid-signal post swings from 1.3 to 19.3 across five product and event groups.
Public TikTok and Instagram posts uploaded 1 May to 31 October 2026 by UK and US creators. Method and limits at the foot of the page.
TikTok and Instagram posts uploaded 1 May to 31 October 2026, UK and US creators, read 18 to 20 November 2026
Two definitions up front. By UGC, we mean public TikToks that matched none of our TikTok ad-label, Shop, or screened partner/gift caption rules (undisclosed deals, unlabelled gifts, and unscreened third-party partner tags sit inside this bucket, while retailer-labelled posts mentioning Nike sit outside it). And because raw views mostly reflect creator follower count, we benchmark each TikTok against that creator's own six-month median views and call anything hitting 3 times their usual or more a standout (14.8% across the 12,487 Nike TikToks with a usable baseline). That measures attention against a creator's normal reach — not sales, sign-ups, or search lift.
1. The "well, it's Nike" test: Nike vs adidas, New Balance, and Puma
Before lifting anything from Nike's creator footprint, it helps to separate Nike's scale from its hit rate. Using the same indexed six-month slice for UK and US creators across all four brands (same ingestion rules, same 10-post creator baseline, using strictly platform ad-labelled non-Shop posts as the denominator; note that brand-specific partner hashtags are still screened out of the UGC numerator):
Nike vs rivals: observed standout rates in Kyra's indexed dataset
Same 1 May to 31 October 2026 window and 10-post creator baseline (eligible counts: Nike 6,465 · adidas 5,156 · NB 2,824 · Puma 1,289). Uneven post ages at capture; descriptive rates, not an age-aligned ranking.
Higher tag volume does not guarantee a higher observed standout rate. Nike leads on indexed post volume (6,915 posts from 3,436 creators), ahead of adidas (5,460), New Balance (2,984), and Puma (1,366). Across baseline-eligible indexed posts, observed standout rates were 18.8% for Puma (1,289 eligible; 16.9% creator-weighted), 15.7% for adidas (5,156 eligible; 14.6% creator-weighted), 14.1% for Nike (6,465 eligible; 12.9% creator-weighted), and 12.2% for New Balance (2,824 eligible; 11.9% creator-weighted). Because indexed views are captured at uneven post ages without creator-clustered confidence intervals, treat these as observed indexed rates rather than an age-aligned ranking.
More ad-labelled non-Shop posts tagged adidas than tagged Nike. In that same indexed slice, 569 ad-labelled non-Shop posts from 425 creators tagged adidas (10.4% of its posts), compared with 371 from 241 creators (5.4%) tagging Nike. Among those ad-labelled creators, 52.0% tagging adidas had fewer than 100,000 followers versus 37.8% tagging Nike.
New Balance leads on unlabelled volume per ad-labelled post. New Balance sits at 55.5 UGC posts per ad-labelled post (51 ad-labelled posts from 48 creators, 1.7% of its total), ahead of Nike (16.9), Puma (10.5), and adidas (8.2). Because undisclosed gifts and quiet deals sit inside UGC for every brand, a high ratio can reflect lower label volume as much as organic demand.
Nike's captured tag volume is real — a smaller brand will not inherit that volume on day one. What the four-brand split shows is that standout rate and paid-to-UGC balance vary widely across sportswear rivals, and they vary just as sharply inside Nike's own six months.
2. Inside Nike's paid-signal footprint
For Nike itself, we topped up Kyra's indexed dataset by listing every identified creator's public posts over the six months (12,891 posts from 3,512 creators). Start with the posts carrying a visible paid signal: 349 creators published 689 paid-signal TikToks tagging Nike — 441 with TikTok's ad label (excluding Shop), plus 248 carrying a screened partner or ad hashtag (#teamnike, #ad) without the platform label.
Follower counts of creators with and without a paid-signal post
43.6% of creators with a paid-signal post have fewer than 100,000 followers. 66.2% posted one paid-signal TikTok tagging Nike; 23 posted five or more.
Creators with a paid-signal post (349)Other creators tagging Nike (3,156)
Under 10k
5.4%
11.1%
10k to 100k
38.1%
53.4%
100k to 1M
44.4%
31.1%
1M or more
12%
4.3%
Mostly one-off paid-signal posters, heavy in mid-tier. Two-thirds (66.2%) of those 349 creators posted just one paid-signal TikTok tagging Nike in six months; only 23 posted five times or more. Nearly half (43.6%) have fewer than 100,000 followers.
More product-centred on screen, flat at the median, spiky in the tail. In our 1,830-post random sample, Nike was the main subject in 69.6% of ad-labelled videos, compared with 31.7% of the remaining sample. Among baseline-eligible posts, the median ad-labelled non-Shop post performed right in line with the creator's usual views (1.05 times), while 111 of 417 (26.6%) hit 3 times usual or more (versus 1,631 of 11,551, or 14.1%, for UGC). One important limit: brands can put paid promotion behind ad-labelled posts and public data cannot separate organic reach from boosted reach.
Not every ad-labelled post tagging Nike is a Nike-funded brief. Of the 441 ad-labelled non-Shop posts, 192 carried a recognised Nike partner hashtag, at least 41 carried only another company's partner tag (most often a sports retailer), and 208 carried neither recognised partner-tag pattern.
Paid
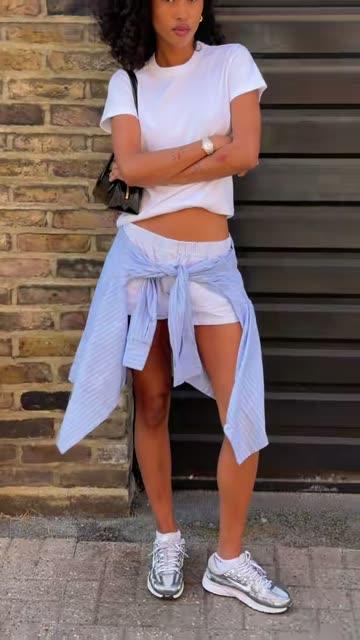
One sneaker styled two ways, day to evening
15.9M views · 1,517× this creator's usual
Paid
Day in the life in one pair of shoes
7.8M views · 490× this creator's usual
Paid
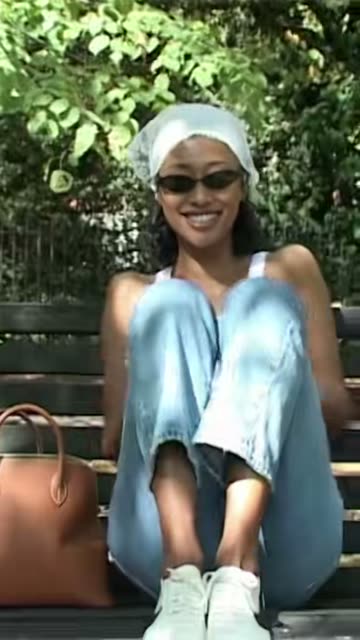
Slow sunny day outdoors in comfy sneakers
970,000 views · 92× this creator's usual
Three ad-labelled posts tagging Nike. Stills from public TikTok videos.
3. The content cycle: 1.3 to 19.3 UGC posts per paid-signal post across five moments
Zoom out to all 12,891 Nike-tagged TikToks and 11,914 (92.4%) are classified as UGC under our label and caption rules, alongside 689 paid-signal posts, 94 gifted posts (a floor, since TikTok has no gift label), and 194 TikTok Shop or commission posts. Across all Nike posts, that is 17.3 UGC posts per paid-signal post, and 83.1% of that UGC comes from creators with no detected paid, gift, or Shop signals in their Nike-tagged posts across the six months.
Paid, gifted, TikTok Shop and UGC: 12,891 creator posts
UGC here means no ad label, no partner hashtag, no Shop link and no mention of a gift. Paid and gifted are floors: deals and gifts nobody mentioned can't be seen.
7.6%
92.4%UGC
The other 7.6%, by kind (posts):
Paid: TikTok ad label
441
Paid: partner hashtag, no label
248
Gifted or invited
94
TikTok Shop
194
A single brand-wide ratio hides how differently individual moments behave. Across five caption-matched Nike product and event groups with at least 10 paid-signal posts each, the ratio ranged from 1.3 to 19.3 UGC posts per paid-signal post:
UGC posts for each paid post
Posts that tag Nike and name each of these in the caption, where at least 10 of them are paid. Longer bars mean more UGC round each paid post.
Vomero running shoe · 296 posts
19 to 1
After Dark night races · 536 posts
8 to 1
Air Max · 130 posts
6 to 1
NikeSKIMS · 54 posts
1.8 to 1
Pegasus running shoe · 49 posts
1.3 to 1
Every post that tags Nike
17 to 1
Vomero running shoe:19.3 UGC posts per paid-signal post (270 UGC against 14 paid-signal, 296 posts total).
After Dark women's night races:7.9 to 1 (461 UGC against 58 paid-signal, 536 posts total).
Air Max:6.3 to 1 (107 UGC against 17 paid-signal, 130 posts total).
NikeSKIMS (1.8 to 1, 34 UGC and 19 paid-signal across 54 posts) and Pegasus (1.3 to 1, 27 UGC and 21 paid-signal across 49 posts) had the lowest ratios shown, though both samples are small and UGC still made up more than half of each group.
Outside Nike's own calendar, the World Cup topped every Nike-owned moment: 247 Nike-tagged posts, with 233 UGC against 8 paid-signal (29.1 to 1). It is a global tentpole, not a Nike product launch, which is why we keep it separate from product drops.
Sequence check 1: 127 UGC posts appeared in the five weeks before After Dark paid-signal posts peaked
Across the After Dark series, creators posted 127 UGC videos alongside 3 paid-signal posts (and 4 gifted) in the five weeks leading up to the busiest week (starting 19 October), filming registration drops, outfit prep, and course practice. Then 40 of the 58 paid-signal posts landed in that single peak week (160 UGC, 40 paid-signal).
After Dark, week by week: 127 UGC posts appeared before paid-signal posts peaked
Posts that tag Nike and name After Dark, by the week they went up. The paid posts are concentrated in the busiest week, which starts 19 October.
UGCPaid or gifted
2
7 Sep
14
14 Sep
28
21 Sep
20
28 Sep
13
5 Oct
59
12 Oct
206
19 Oct
94
26 Oct
Sequence check 2: Vomero's paid-signal count peaked in May, before UGC peaked in June
On Vomero, the calendar ran in the opposite order on smaller numbers: 6 of the 14 paid-signal posts went up in May, while UGC peaked in June (73 posts) and July (69 posts) and continued through October. Public timestamps show posting sequence, not cause — they cannot prove paid posts triggered the UGC — so the practical takeaway is measurement: track UGC posts per paid-signal post launch by launch rather than assuming one brand-wide ratio covers every drop.
4. What stood out on screen (and three briefs to test)
Split Nike's TikToks by what appears on screen and one pattern holds across four independent cuts of the data: videos centred on the product stood out roughly twice as often as videos where Nike was only worn in passing or absent.
Four ways of asking the same question, one answer
Share of posts that were standouts: three times the creator's usual views or more. Across baseline-eligible posts (12,487 of 12,891): 14.8%.
Stands out more often than posts in generalLess often
What the video is about (1,830 randomly chosen posts)
Nike is the main subject
21.2%
Nike is there in passing
10.8%
The kind of video (same posts)
Close-up, review or unboxing
22.2%
Day-in-the-life vlog
8.6%
Which accounts the post tags (every post)
Only Nike
19.5%
Nike and four or more others
11.9%
What the caption talks about (every post)
Sneakers
20.8%
Football
20.0%
Running
11.3%
Gym and workouts
7.4%
Main subject vs incidental or absent: Among baseline-eligible posts in our 1,830-post random visual review, videos with Nike as the main subject stood out 21.2% of the time (127 of 598 eligible), versus 10.8% (71 of 660 eligible) when Nike was incidental or absent. Inside UGC alone, the gap is almost identical (20.9% vs 10.6%).
Close-ups vs vlogs: Product close-ups, reviews, and unboxings stood out 22.2% of the time, more than double day-in-the-life vlogs (8.6%) and sport footage (8.6%).
Sneakers and football vs running and gym: Running is Nike's most-tagged sport (18.2% of captions) and one of its lower standout categories (11.3%; gym sits at 7.4%). Sneaker (20.8%) and football (20.0%) captions stood out roughly twice as often.
Below are three repeatable formats from our frame-by-frame review. None of the three featured five-beat breakdowns carried an ad label, partner tag, gift mention, or Shop link.
Format 1: The head-to-head
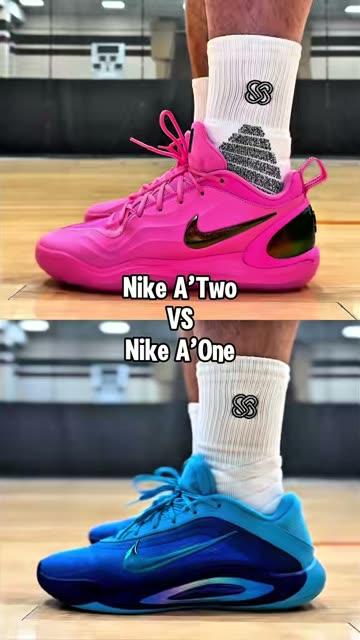
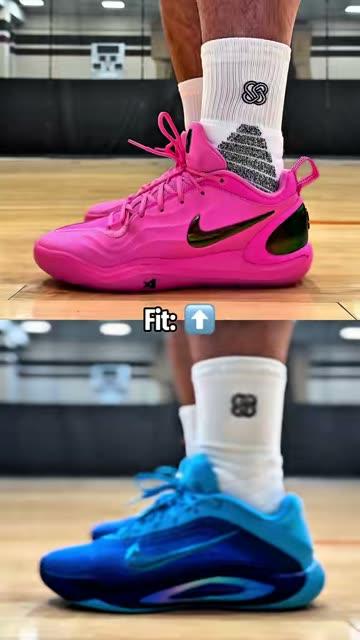
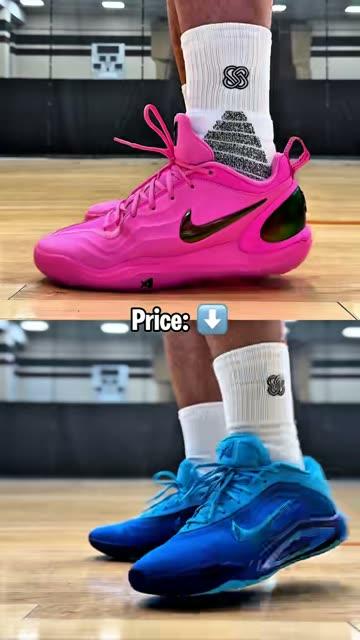
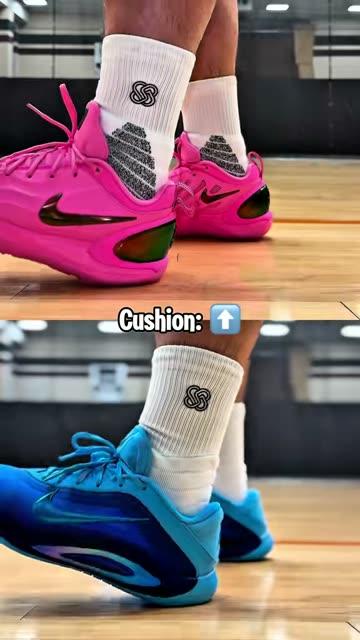
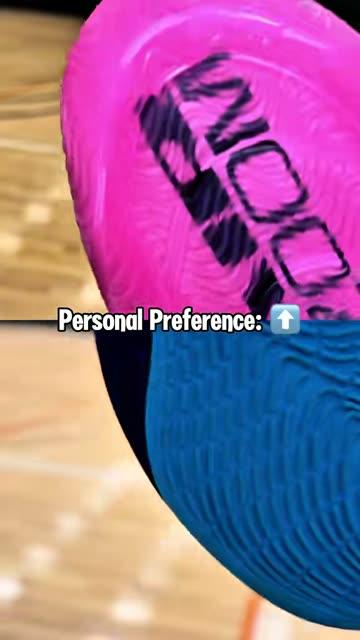
Nike A'Two against A'One, scored one category at a time61 seconds · 110,000 views · 11× this creator's usual · UGC
0:00
The title card names both shoes: the new A'Two on top, the A'One below.
0:04
First category, fit. An arrow gives it to the new pair.
0:08
Price goes to the old pair. The new one doesn't win everything.
0:28
Same court, same shot, one category at a time. No voice, only music.
0:59
The last category: personal preference.
Five moments from one video. Stills from a public TikTok video.
A creator took the Nike A'Two (A'ja Wilson's newer basketball shoe) and the A'One it replaced onto the same court and scored them round by round (fit, price, traction, personal preference) with an on-screen arrow picking each winner. No voiceover, just music, 61 seconds long. It pulled 109,686 views: 11.4 times that creator's usual. Letting the older shoe take the price round gives the comparison a real trade-off rather than a one-sided pitch. Across all 12,891 posts, captions framed around a ranking, rotation, or head-to-head stood out 26.8% of the time (versus 14.8% across all baseline-eligible posts).
UGC
In-hand 360 look at a new release
34,000 views · 51× this creator's usual
UGC
Slow 360 close-up of a new boot colourway
55,000 views · 36× this creator's usual
UGC
Aesthetic unboxing of new running shoes
18,000 views · 56× this creator's usual
UGC
Rare sneaker detailed look from every angle
105,000 views · 15× this creator's usual
UGC
Lacing up vintage boots for a first touch
315,000 views · 8× this creator's usual
The product is the video. Stills from public TikTok videos.
UGC
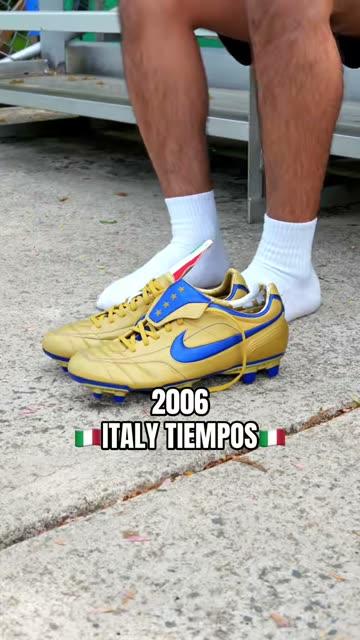
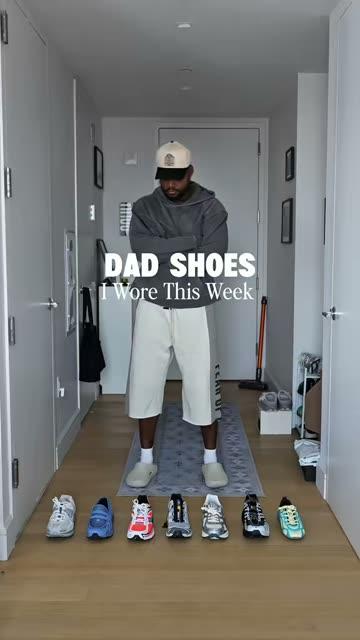
Every shoe I wore this week, labelled
262,000 views · 7× this creator's usual
UGC
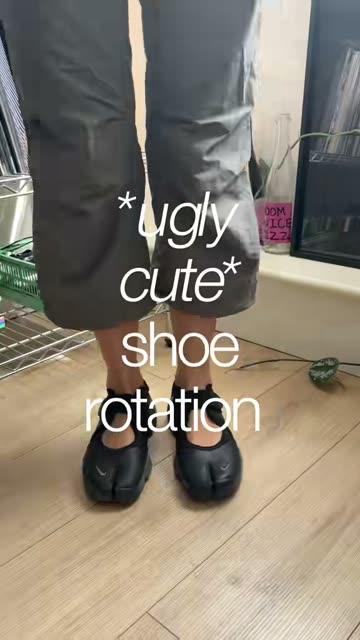
My rotation of quirky shoes, each labelled
26,000 views · 31× this creator's usual
UGC
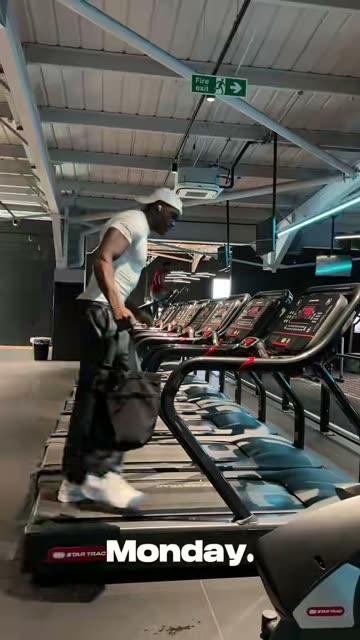
A different gym outfit each weekday
22,000 views · 21× this creator's usual
UGC
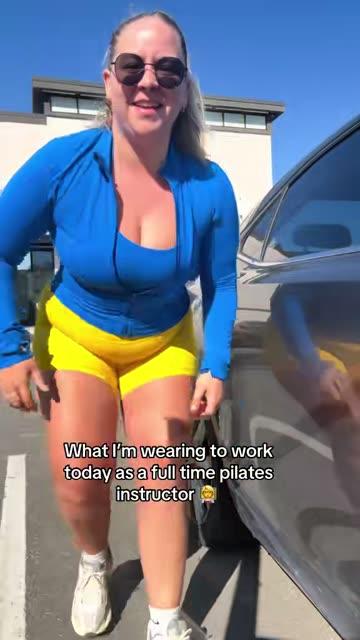
What I wear to work in my job
4,000 views · 6× this creator's usual
Lists, rotations and series. Stills from public TikTok videos.
Brief to test: Ask for a comparison or scoring structure, not a mention. "Old model vs new model, scored across five rounds." "My five-pair rotation." "Every angle in fifteen seconds." Product on screen first and last, and leave room for the creator to give at least one category away.
Format 2: The pre-event utility guide
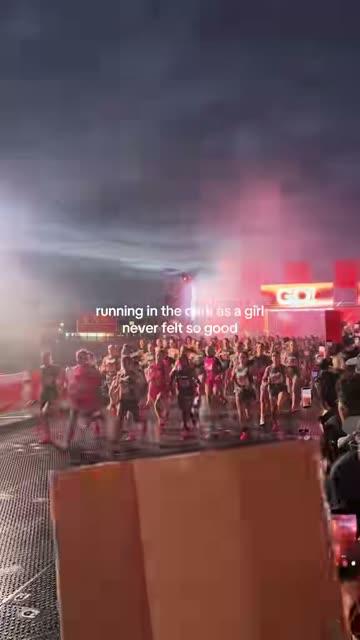
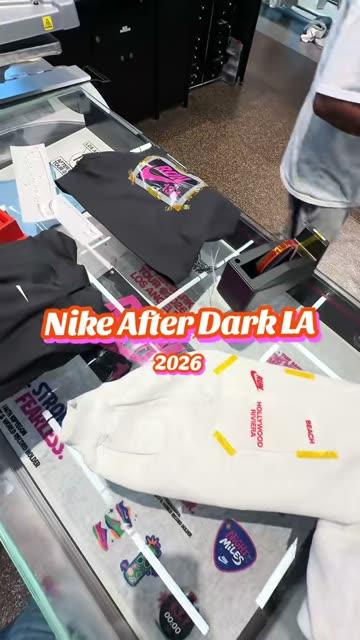
After Dark had 147 creators publishing 536 posts across weeks: registration misses, outfit prep, merch customisation, start line, and finish line.
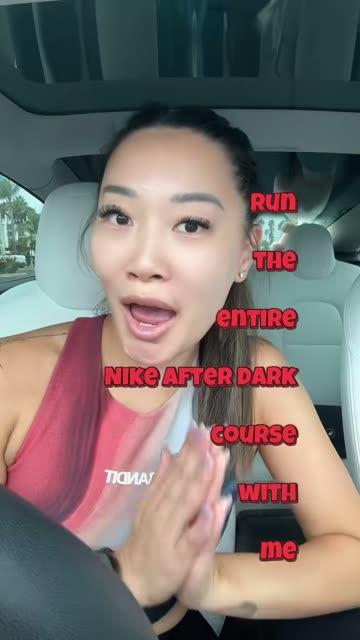
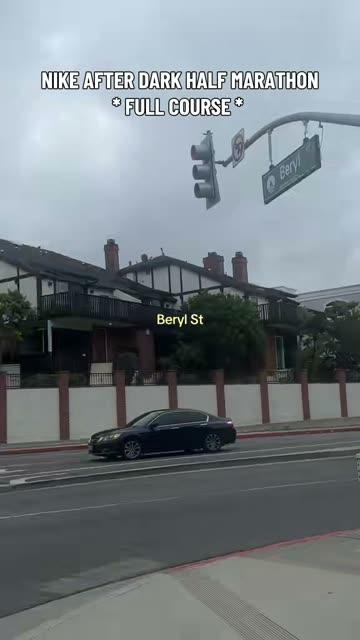
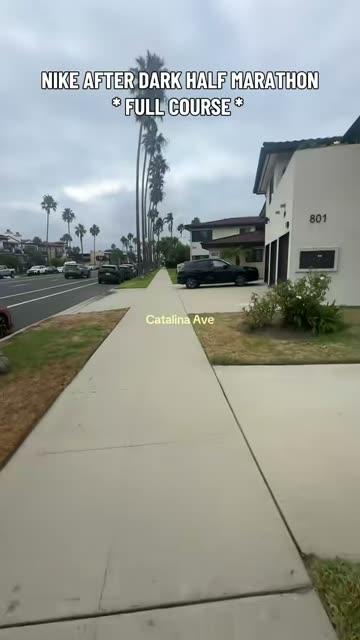
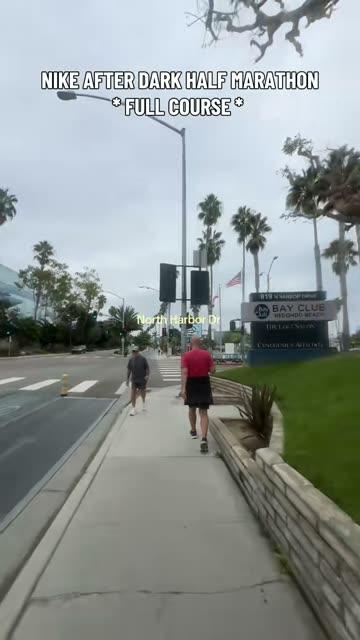
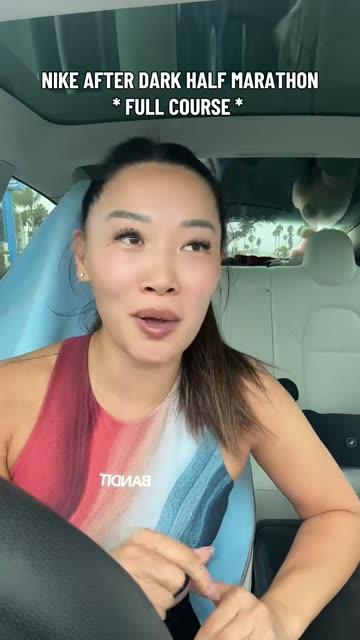
The After Dark race course, run before race day9 minutes · 17,000 views · 21× this creator's usual · UGC
0:00
The creator says what you'll get: the whole course, before race day.
0:35
Street names on screen. Viewers are told to screenshot the notes.
3:38
Turn by turn, at running pace.
6:40
More of the route, each street named on screen.
8:12
Back in the car near the end.
Five moments from one video. Stills from a public TikTok video.
This creator ran the entire course before race day and filmed it turn by turn, putting every street name on screen and telling runners to screenshot the notes. It runs 517 seconds (over eight minutes) and hit 21.4 times that creator's usual views.
Per post, After Dark videos were close to Nike's overall standout rate (18.1% vs 14.8% overall, too close to call). The standout feature of the cohort was breadth: 147 creators filming the same event from multiple angles. Outside events drew high standout rates too: the 247 World Cup posts tagging Nike hit 23.9% standouts.
UGC
Night race vlog from start line through the course
755,000 views · 406× this creator's usual
UGC
In-store race merch customisation, start to finish
19,000 views · 24× this creator's usual
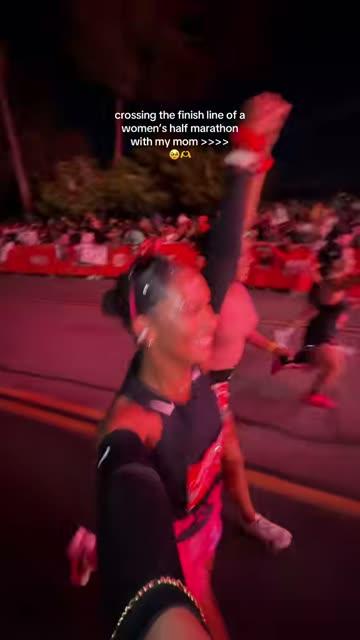
Paid
Crossing the finish line with mum
33,000 views · 7× this creator's usual
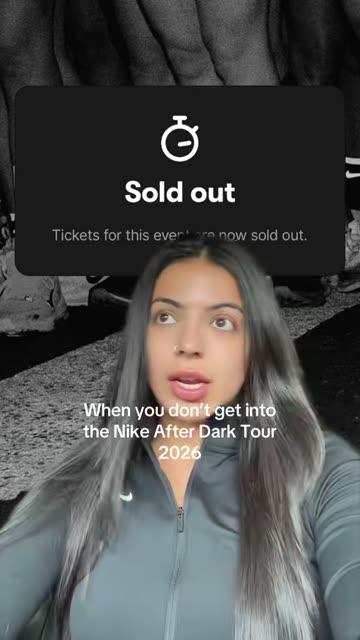
UGC
Reaction skit to a sold-out brand event
11,000 views · 5× this creator's usual
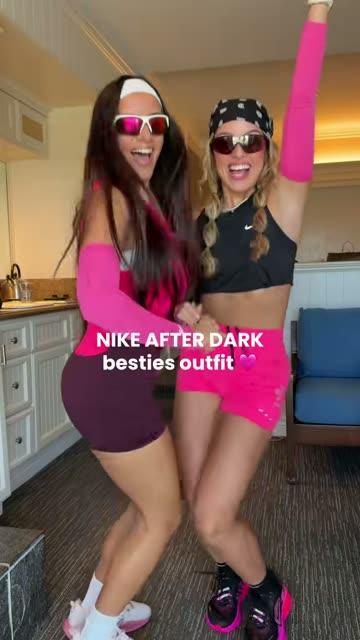
Paid
Besties matching outfit transition reveal
8,000 views · 10× this creator's usual
A night race series, filmed before, during and after. Stills from public TikTok videos.
Brief to test: Storyboard an event's filmable beats before the day itself: sign-up, kit pickup, venue or route preview, event night, and recovery. Give paid creators access nobody else has and test a practical "what to expect" guide alongside event-night recaps.
Format 3: The spec explainer
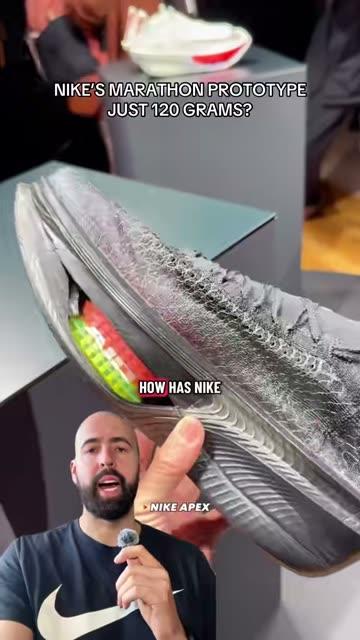
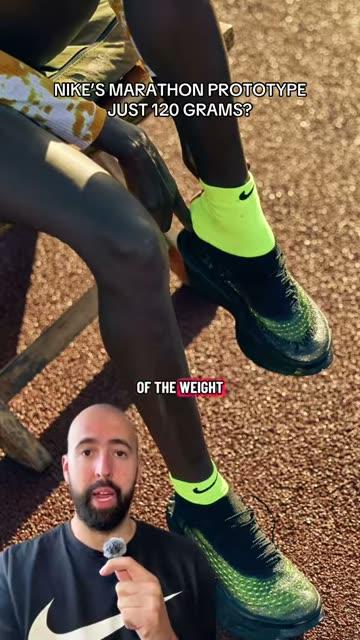
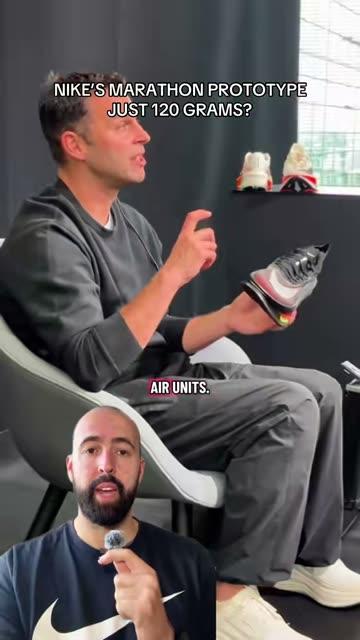
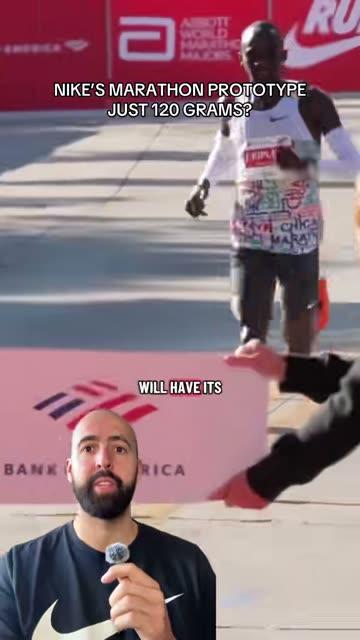
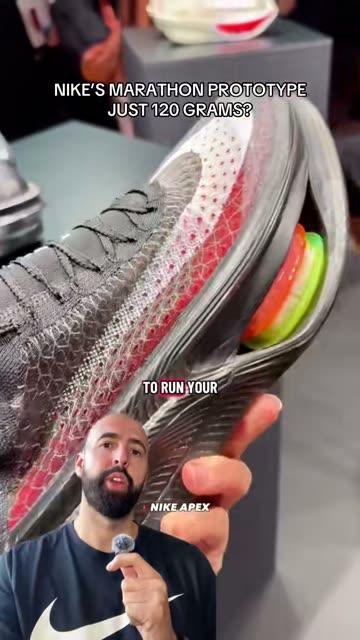
How Nike made a marathon shoe lighter40 seconds · 39,000 views · 38× this creator's usual · UGC
0:00
It opens on a question with a number in it.
0:06
One fact per shot, with the shoe on screen.
0:19
Footage of the shoe being shown and talked through.
0:32
The payoff: a race where the shoe will be worn.
0:38
It ends where it began, on the shoe.
Five moments from one video. Stills from a public TikTok video.
Nike announced it had cut nearly a third of the weight from a prototype marathon shoe. A running-news creator turned that single spec into a 40-second explainer: opens on a question with a number in it, delivers one fact per shot over the shoe, and finishes on the weekend marathon where it would race. Result: 37.5 times that creator's usual views.
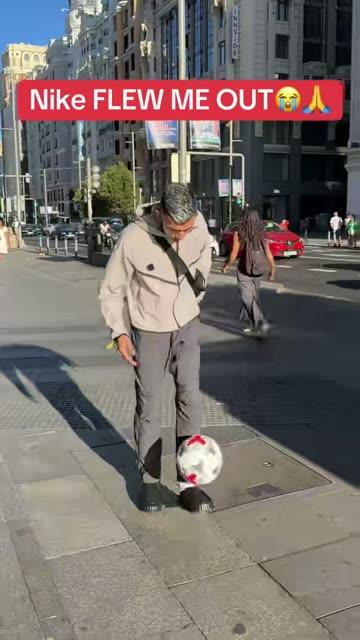
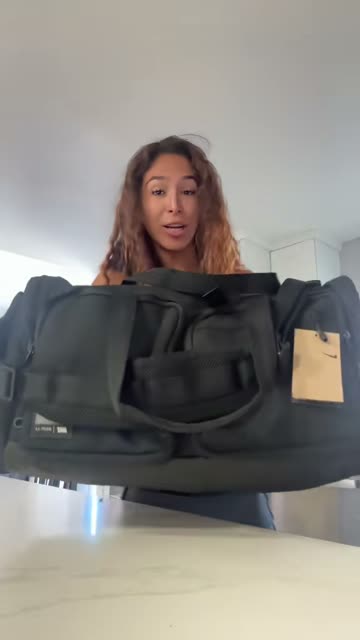
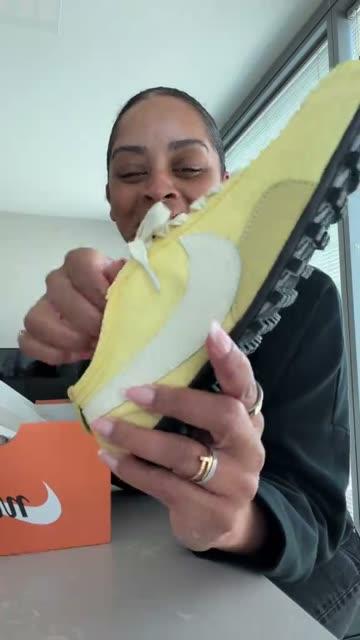
A similar pattern appears when creators react directly to something Nike released or staged: an advert breakdown, a parcel unboxing (note that one still below discloses a gifted bag in the video itself even without a caption gift tag), or a hosted store challenge.
Paid
Brand-hosted trip vlog with timed store challenge
1.0M views · 4× this creator's usual
Gift disclosed in video
Brand gift unboxing with try-on
3.0M views · 4× this creator's usual
Gifted
Reluctant-influencer unboxing of a surprise package
13,000 views · 6× this creator's usual
Made out of something the brand did. Stills from public TikTok videos.
Brief to test: Hand creators the raw material and hold back the script: what changed in the product, one sharp spec they can open on, early access, or behind-the-scenes footage. Give them a concrete fact worth reporting rather than talking points to read.
What didn't separate standouts, and what you can't copy
Opening style in the first three seconds. Across 254 standout videos and 192 control videos reviewed with ten frames and 90-second transcripts, no clear opening-style difference emerged between text on screen, spoken line to camera, product first, or straight into action. Focus creative direction on the video's premise rather than policing the first three seconds.
Star power and built-in demand. Reviewers flagged 35 of the 145 reviewed top-150 posts (24.1%) as relying on a star or special access (a pro footballer, national team, or celebrity), and 40.7% of all 150 carried a paid, gifted, or Shop signal (versus 7.6% of all 12,891 posts). Formats can be tested tomorrow; Nike's captured tag volume and celebrity access cannot.
5. Beyond TikTok tags: Instagram, TikTok Shop, and co-tagging
Three signals sit outside Nike's standard TikTok creator tags:
Beyond Nike's TikTok tags: Instagram, TikTok Shop, and co-tagging
Three signals alongside TikTok creator volume, 1 May to 31 October 2026. Instagram Stories are not visible in public feed data.
Seller IDs recorded on 10 of 101 indexed rows (91 missing)
9.0%
Also tag @lululemon
7.9% tag @adidas · 5.5% tag @gymshark
Instagram: low paid-partnership label share, big median plays on Collabs. Of 5,765 public Instagram posts tagging or co-authored with Nike's main accounts (2,504 creators), 43 (0.7%) carried a paid partnership label. The 18 Collab posts co-published with Nike accounts had 2.0 million median plays (1,997,496). Instagram Stories are not visible in public feed data, so live-event Story volume sits outside these counts.
TikTok Shop: small share, mostly missing seller IDs. Across the full merged dataset, 194 TikToks (1.5%) carried a Shop or commission signal, standing out 17.3% of the time (versus 17.4% for gifted and 14.1% for UGC among baseline-eligible TikToks — too close to claim a clear gap). In our indexed seller table (101 Shop posts), seller IDs were recorded on 10 posts and missing on 91; Nike has no official TikTok Shop seller configured in our dataset, so we cannot verify Nike's own Shop strategy from public posts alone.
Heavy co-tagging with rivals, lower standout rate in multi-brand bundles.9.0% of Nike-tagged TikToks also tag @lululemon, 7.9% tag @adidas, and 5.5% tag @gymshark. Posts tagging only Nike stood out 19.5% of the time, versus 11.9% for posts tagging four or more additional accounts.
6. Four tests for your next creator brief
Test a head-to-head or rotation brief. Old vs new, five-item lineup, or product close-up. Keep the product in frame first and last, and let the creator concede at least one trade-off.
Map tentpole events into multi-week beats. Brief practical "what to expect" utility guides ahead of event day rather than concentrating every deliverable on recap vlogs.
Brief one sharp product spec, not a script. Give creators early access and one verifiable detail they can turn into a 40-second explainer.
Test product-led briefs against day-in-the-life vlogs. Day-in-the-life vlogs are Nike's most common format and stood out 8.6% of the time versus 22.2% for product close-ups and reviews — worth A/B testing before funding another lifestyle-heavy wave.
One metric to add to your campaign wrap: track UGC posts per paid-signal post launch by launch, alongside your category rivals. Across sportswear in our indexed slice (using platform ad-labelled non-Shop posts as the denominator), that ratio ran from 8.2 (adidas) to 55.5 (New Balance); inside Nike's five caption-matched groups (using all paid-signal posts), it ran from 1.3 to 19.3.
How we ran this analysis, and its limits
Public data scope and sources: Public TikTok posts tagging @nike or @nikefootball (12,891 posts, 3,512 UK and US creators) and public Instagram feed posts tagging or co-authored with Nike's main accounts (5,765 posts, 2,504 creators), uploaded 1 May to 31 October 2026. For Nike's TikTok set, we started from Kyra's indexed public social dataset and refreshed each identified creator's public posts over the six-month window; creators outside that initial pool, untagged UGC, and Instagram Stories are not captured, so totals are floors.
Rival benchmark basis: To compare Nike, adidas (@adidas), New Balance (@newbalance), and Puma (@puma, @puma.uk) apples-to-apples, Section 1 uses Kyra's indexed dataset (without live top-up) for all four brands on the same ingestion basis, the same 1 May to 31 October 2026 window, strictly platform ad-labelled non-Shop posts, and the same 10-post creator baseline. Nike's indexed slice (6,915 posts, 14.1% standouts) tracks its live-refreshed total (12,891 posts, 14.8% standouts) closely.
How TikTok posts are grouped:Paid-signal = TikTok ad label (excluding Shop) or screened partner/ad hashtag in the caption. Gifted = caption says the item or invite was sent. TikTok Shop = Shop link or commission label. UGC = posts matching none of those label or caption rules. Undisclosed deals, unlabelled gifts, and unscreened third-party partner tags sit inside UGC, while retailer-labelled posts mentioning Nike sit outside it. Nothing here implies any unlabelled post required disclosure.
Standouts: A post's views divided by that creator's median views across all their posts in the six months (creators with at least 10 posts: 12,487 of 12,891 Nike posts). Views include any paid promotion behind a post. Both the main-subject gap and the product-led vs diary gap hold when each creator is counted once, and across both halves of the six-month window.
Visual and creative review:1,830 randomly chosen TikToks were sorted from six frames each into fixed categories by an AI classifier (human accuracy spot-checks were not run on the full 1,830-post sort; treat fine margins as directional). For 665 videos (including 254 standouts from that sample, 192 controls, and 145 of the 150 most-viewed), we reviewed ten frames (four from the first four seconds) plus a transcript of the first 90 seconds, and manually inspected the featured breakdowns frame by frame.
What public data can't show: These are observational patterns in public attention (views), not controlled experiments, and they do not measure checkout sales, sign-ups, search lift, or what anyone was paid. Treat outperforming formats as candidates to test alongside your own conversion data.
Frequently asked questions
How does Nike's creator marketing compare with adidas, New Balance, and Puma?
In Kyra's six-month UK and US indexed slice (1 May to 31 October 2026), Nike led on captured tag volume with 6,915 posts from 3,436 creators, ahead of adidas (5,460), New Balance (2,984), and Puma (1,366). Observed standout rates among eligible indexed posts were 18.8% for Puma, 15.7% for adidas, 14.1% for Nike, and 12.2% for New Balance. More ad-labelled non-Shop posts tagged adidas (569 from 425 creators) than tagged Nike (371 from 241 creators).
How much of Nike's TikTok creator volume is paid versus UGC?
Across 12,891 public UK and US TikToks from 3,512 creators, 11,914 (92.4%) carried no ad label, partner hashtag, Shop link, or gift mention, while 689 carried a non-Shop paid signal — 17.3 UGC posts per paid-signal post overall, ranging from 1.3 to 1 (Pegasus) up to 19.3 to 1 (Vomero) across five product and event groups.
What kind of Nike TikTok videos outperform a creator's usual views?
Across 1,830 randomly reviewed TikToks, videos where Nike was the main subject hit 3x the creator's usual views 21.2% of the time (127 of 598 eligible posts), compared with 10.8% (71 of 660) when Nike appeared incidentally or was absent. Product close-ups, reviews, and unboxings stood out 22.2% of the time versus 8.6% for day-in-the-life vlogs.
Does Nike sell through TikTok Shop?
In our six-month dataset, 194 Nike-tagged TikToks (1.5%) carried a TikTok Shop or commission flag, and 0 indexed Shop rows recorded Nike as the official seller (10 recorded third-party sellers and 91 had no seller ID recorded).
Want this analysis for your brand and category rivals?
Kyra runs a six-month creator benchmark on your brand using public TikTok and Instagram data alongside your in-house team and existing creative partners — mapping your paid/gifted/Shop/UGC mix against rivals, tracking launch-by-launch UGC ratios, and delivering creative briefs to test.


 LinkedIn